Casestudy Category: Data Visualization
Accessible Data Visualizations to Break Usability Barriers
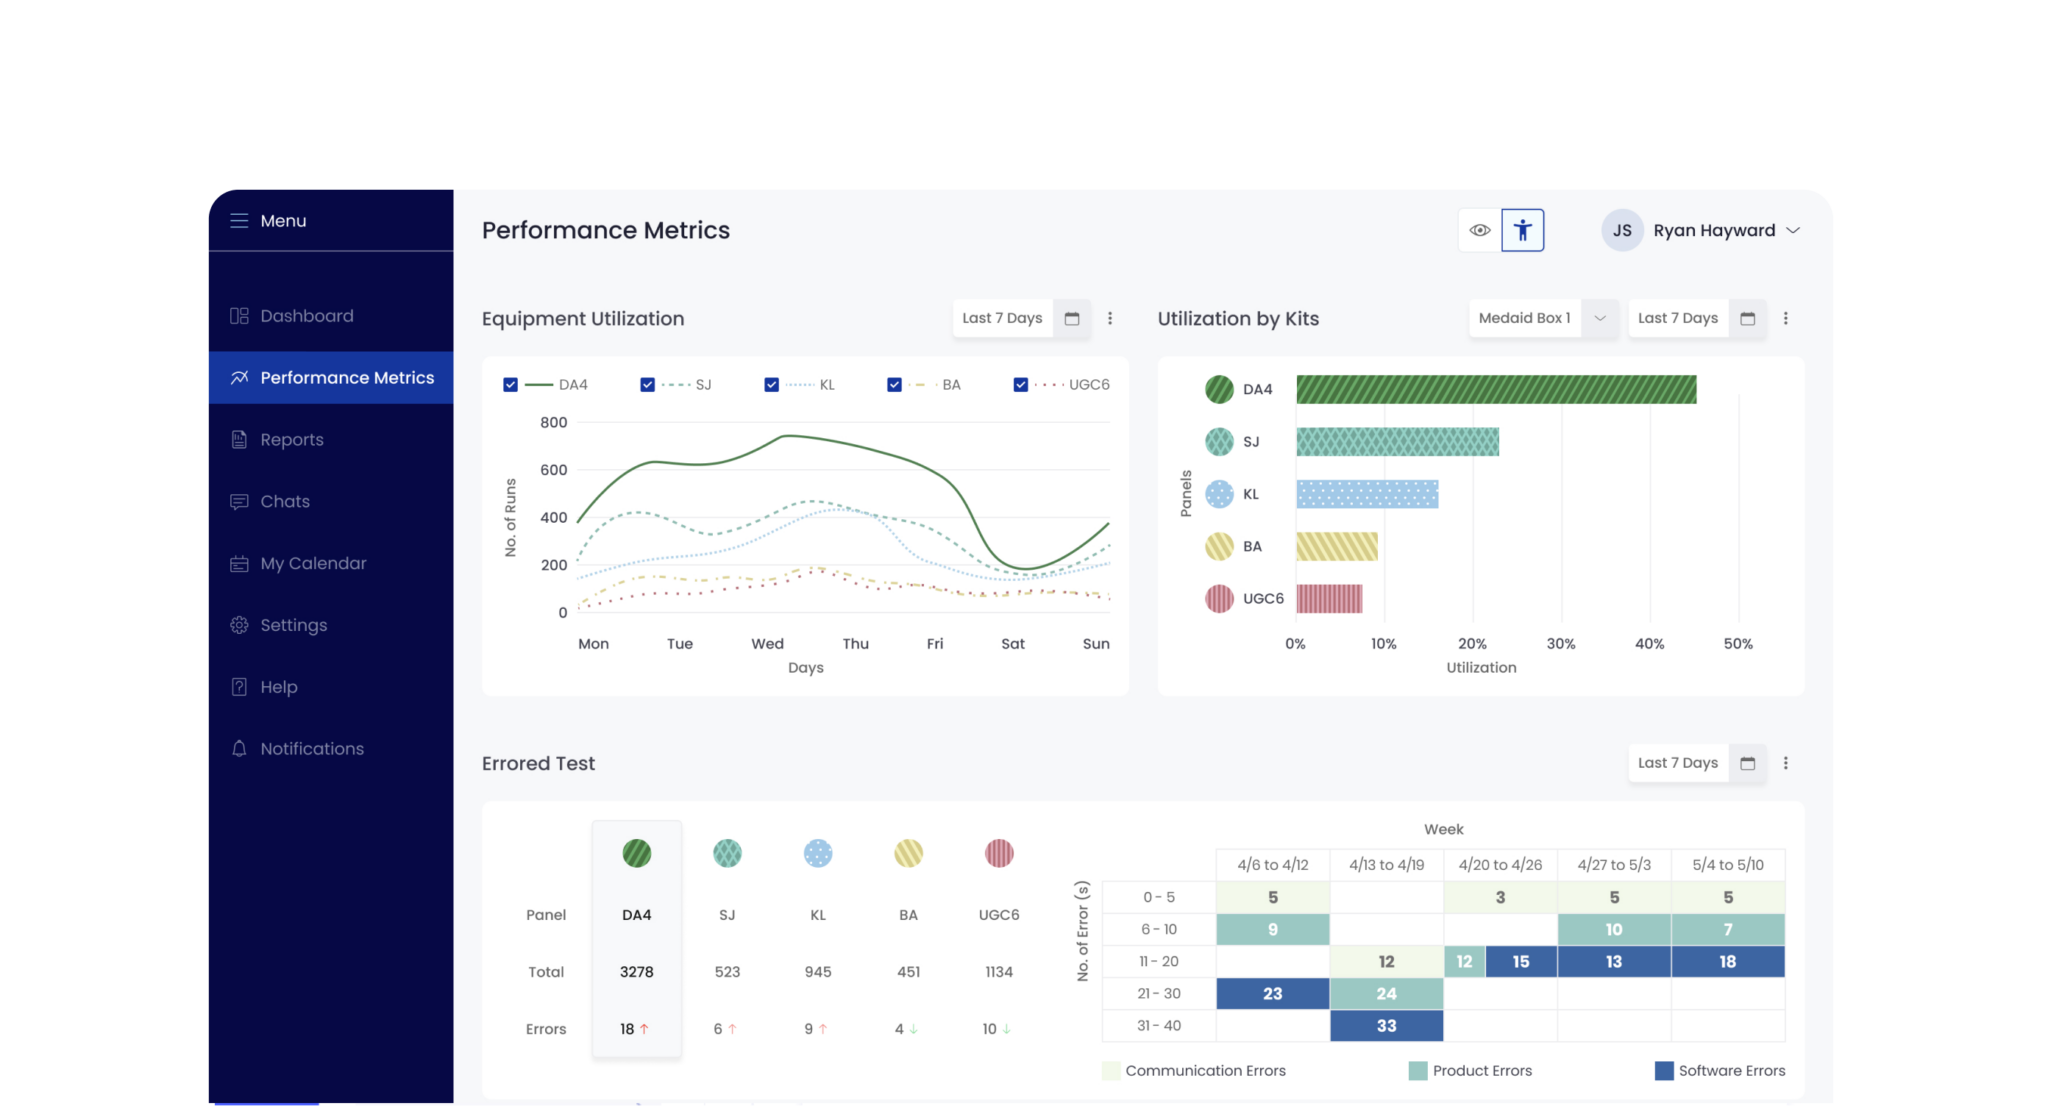
Designing an inclusive and accessible analytics tool to optimize lab operations and error reduction in diagnostics.
Designing an inclusive and accessible analytics tool to optimize lab operations and error reduction in diagnostics.